I saw two patients recently, with a similar degree of hypertension and LVH. One with a normal-sized LA and the other with a mild LA enlargement.
When checked for the “E” declaration time, it was found to be absolutely normal in the patient who had LAE. The one with normal LA size had a relatively short DT and his functional capacity was less.
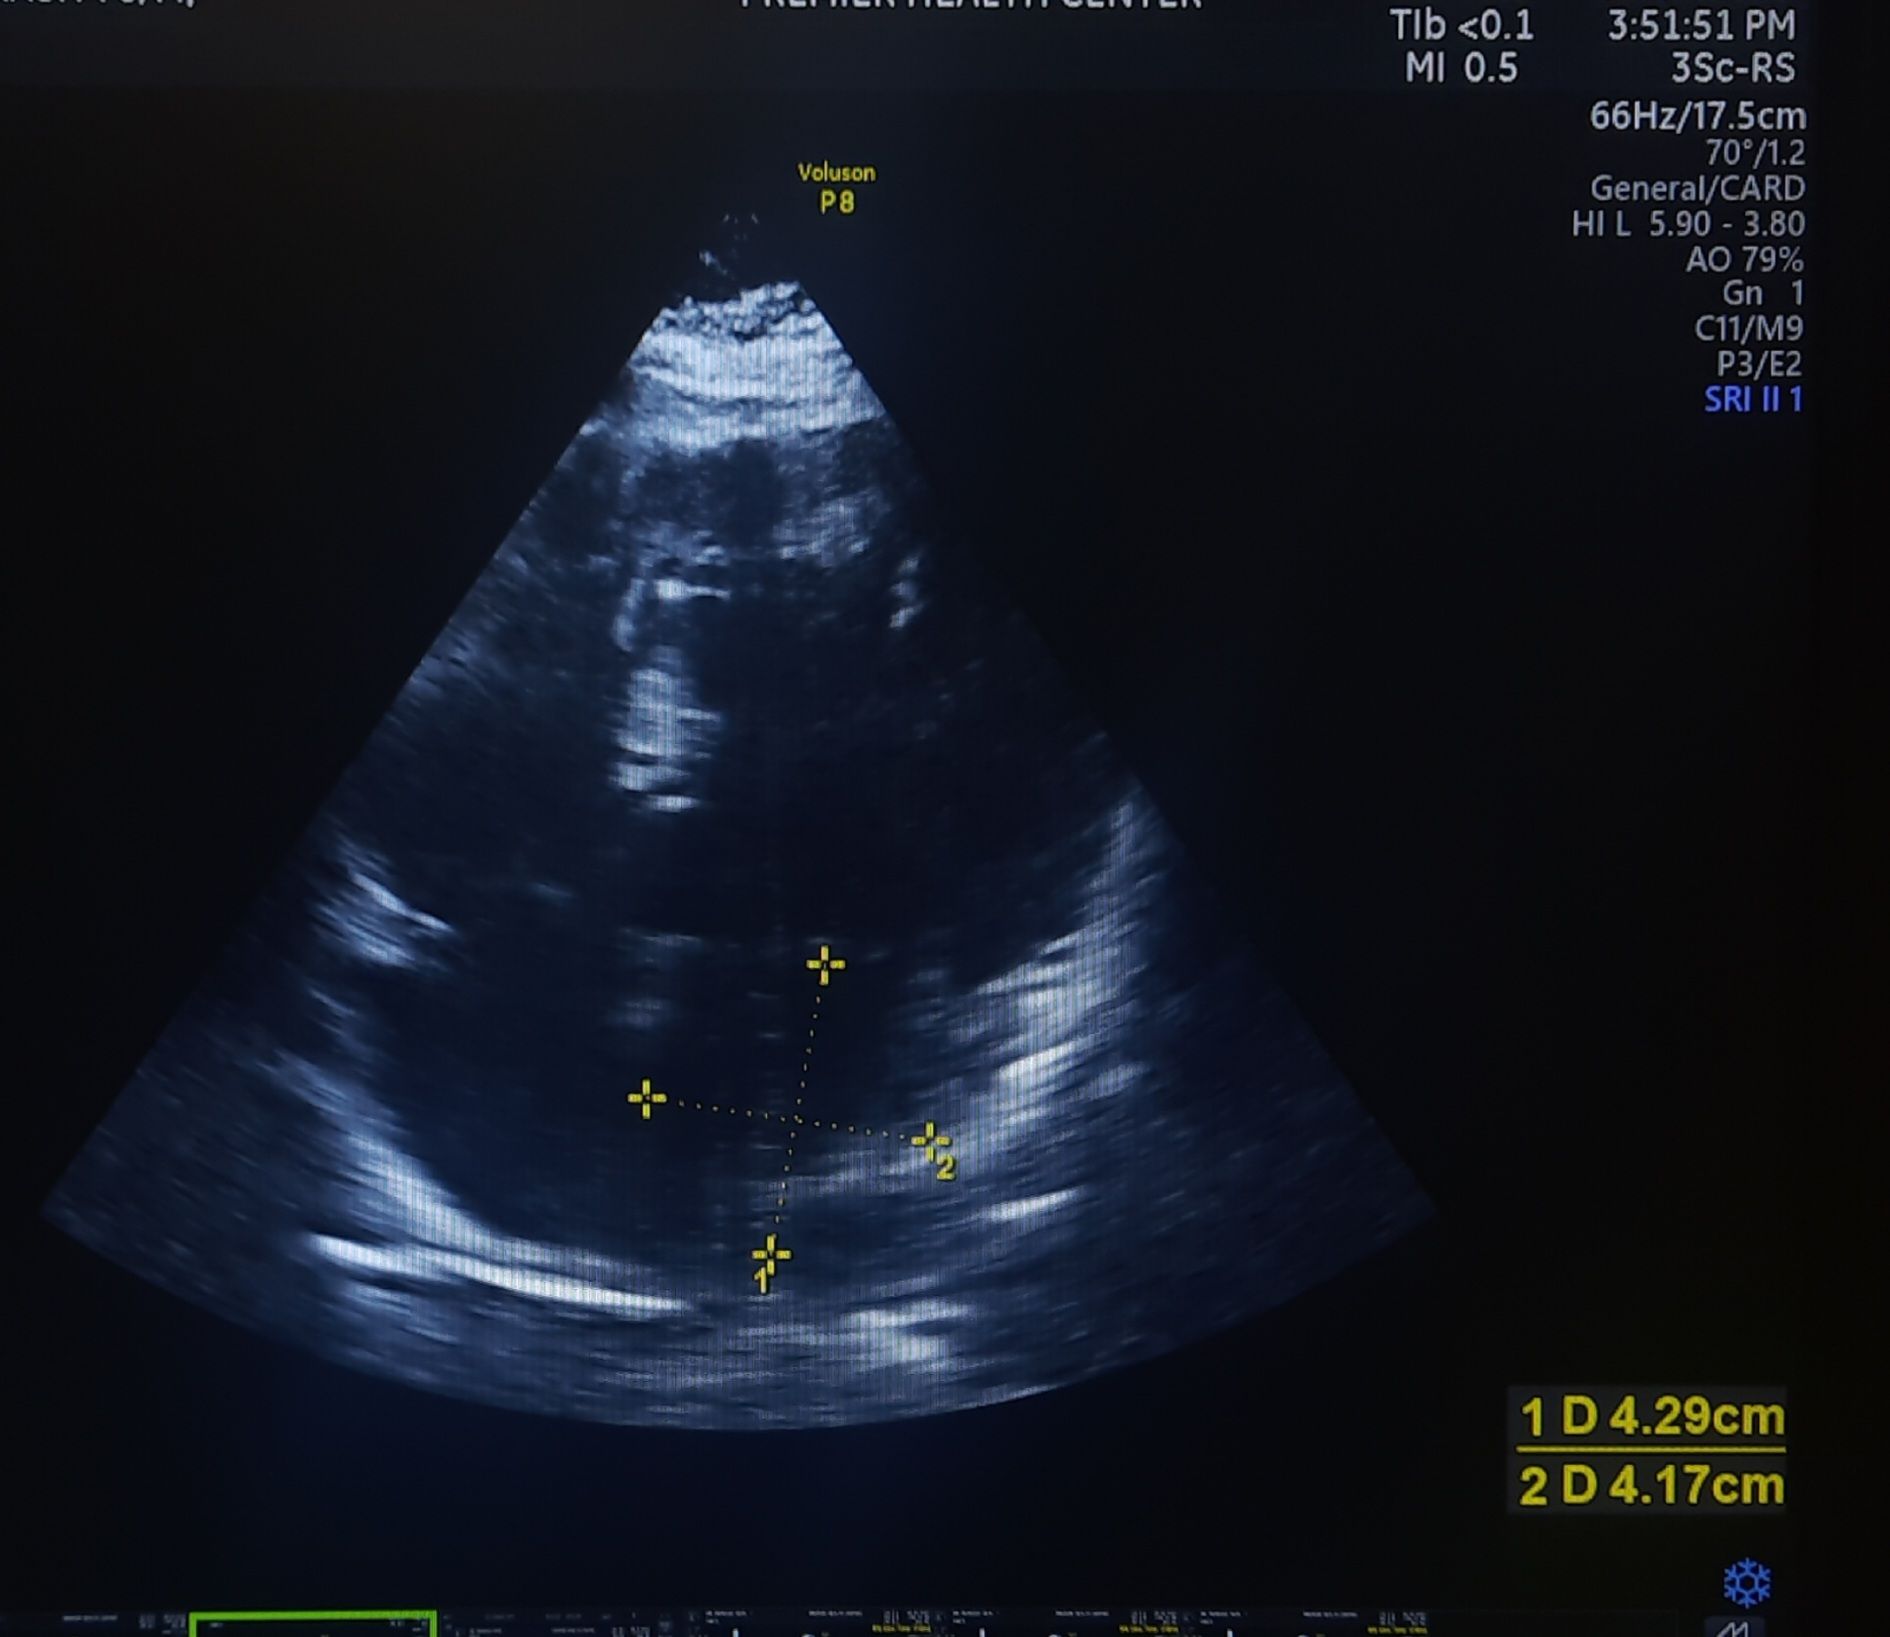
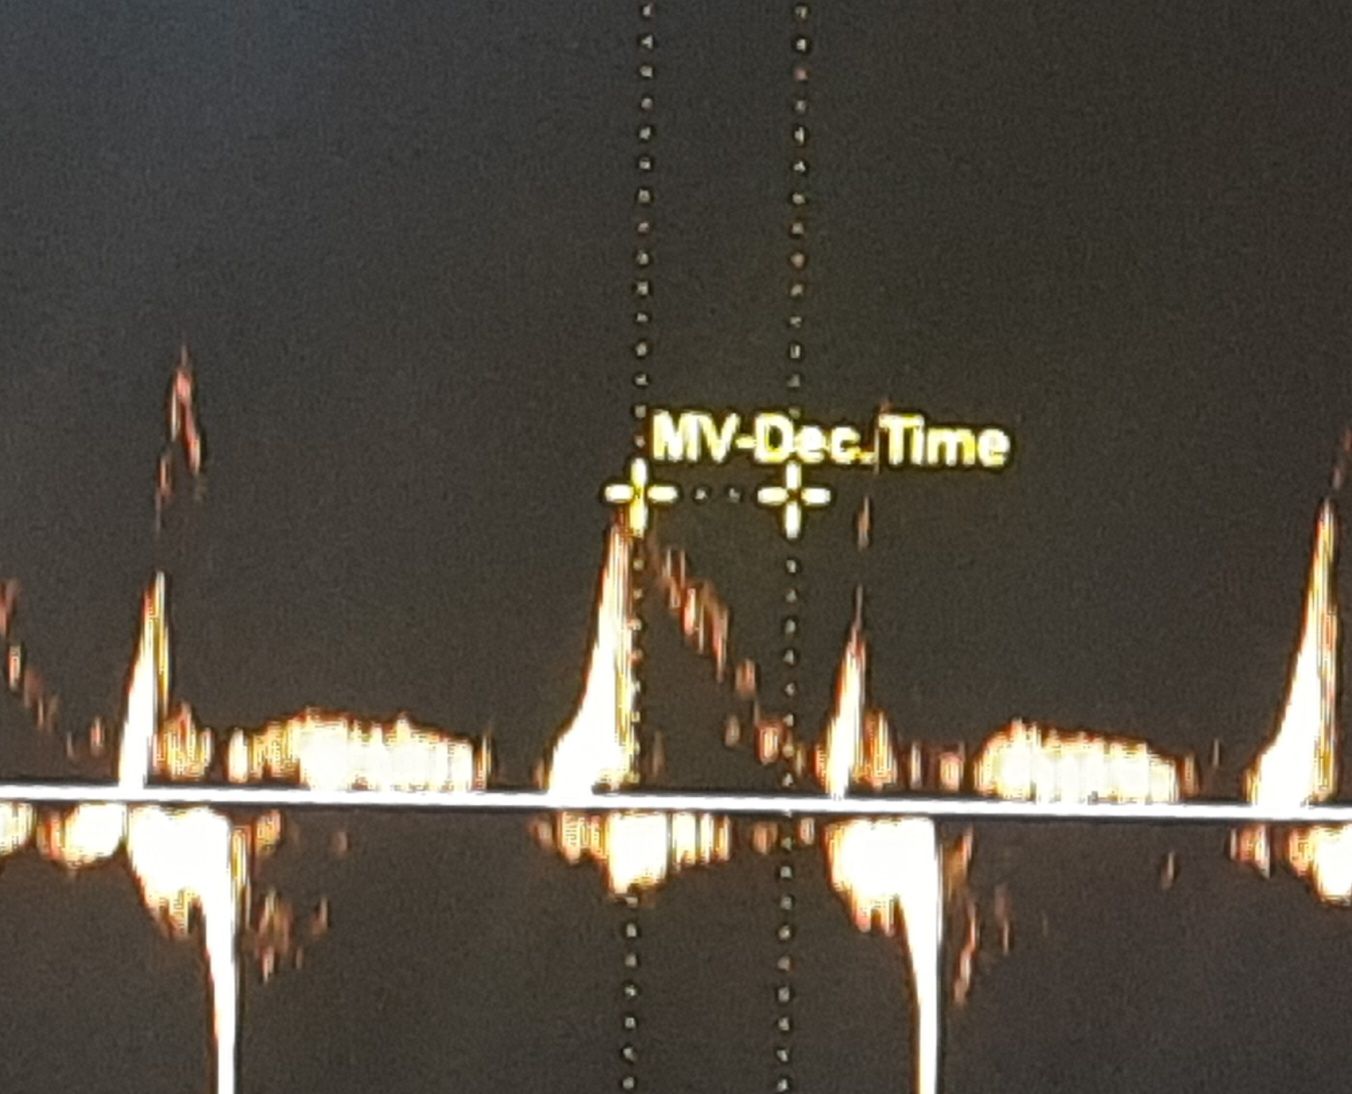

52-year-old man with HT, and LVH with mild LAE. His E DT was very much normal a1 178 ms. He has a good functional capacity. I expected a grade 2 diastolic dysfunction. But, none of the other parameters were convincing. Used to think, if LA is enlarged, it must be a little advanced form of diastolic dysfunction. Though It is still true in many, but, this case, demand us to dwell into these two important parameters of LV diastolic function.
What is the relationship between Left atrial size and Mitral “E” decceleration time ?
The conventional and straightforward answer is they are inversely related.
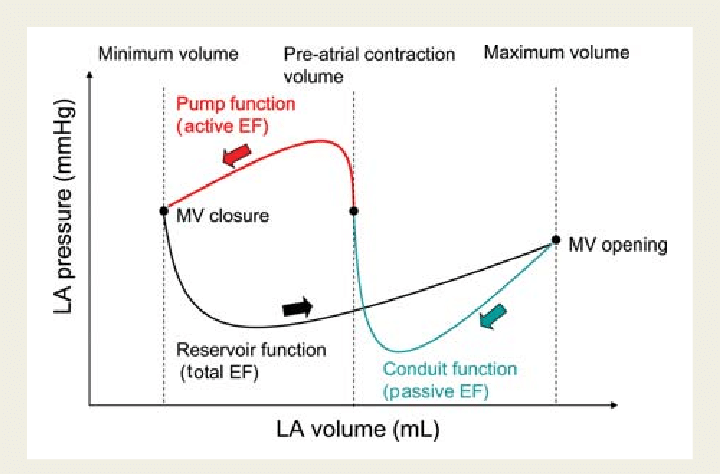
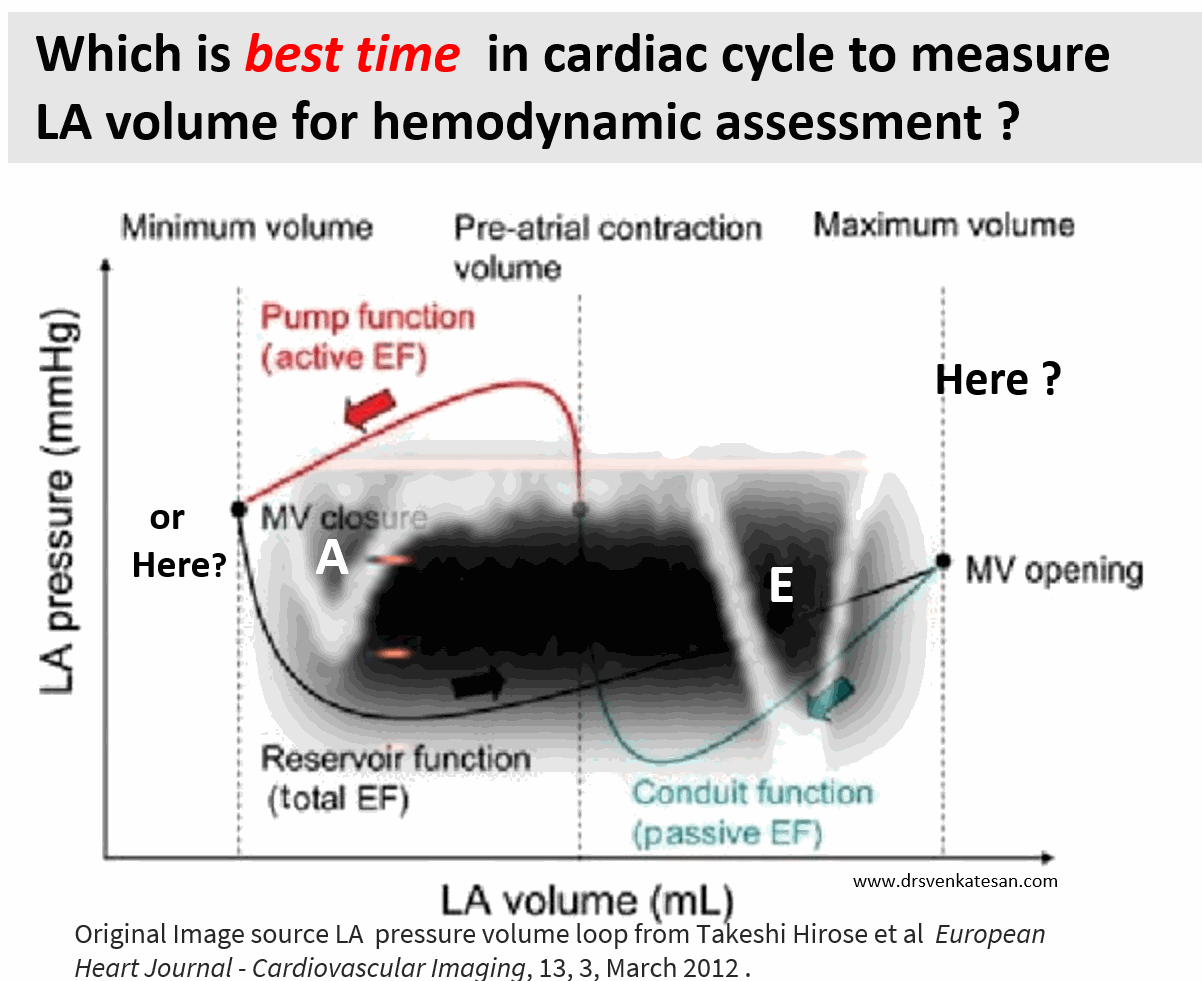
We know Left atrial size typically reflects the chronicity of elevated left atrial pressure or volume overload, which can result from conditions such as mitral valve disease, left ventricular dysfunction, or atrial fibrillation. An enlarged LA is often a marker of prolonged stress on the atrium due to increased filling pressures or impaired left ventricular relaxation.
Mitral E velocity deceleration time (DT) is a measure derived from Doppler echocardiography, representing the time it takes for the early diastolic filling velocity (E wave) to decline from its peak to baseline.
In healthy individuals with normal LA size and normal diastolic function, DT is typically within a normal range (e.g., 160–240 ms), and LA size does not significantly influence DT. In pathological states, an enlarged LA (e.g., LA volume index >34 mL/m²) combined with a shortened DT (<160 ms) indicate restrictive physiology or advanced diastolic dysfunction.
Question 2
Is this Inverse relation always right ?
There is generally an inverse relationship between LA size and mitral E velocity DT in the context of diastolic dysfunction with elevated LA pressure. LA size increases due to pressure overload, DT tends to decrease. However, the exact relationship is much more complex. If LA enlargement is due to volume overload (e.g., chronic mitral regurgitation) without significantly elevated pressure, DT may not shorten dramatically.
If the LA is stiff and non-compliant, the E deceleration time is likely to be short, and an inverse relation is acceptable logic. But, if the LA is more accommodative and relaxed, mild enlargement actually reduces the LA mean pressure, and E deceleration gets normalized even if it was prolonged earlier due to diastolic dysfunction.
LA behaviour is still a mystery X factor in diastolic dysfunction.
This throws up a fundamental question in our understanding of diastolic dysfunction. Some degree of LA flexibility and compliance reduces the LA mean pressure, and could relieve the symptoms. In this process, the mitral DT also is kept within the normal limits. In fact, now I have asked my fellows to analyze a concept of normalization of DT with progressive LA dilatation in hypertensive patients. This is contrary to the belief that LA dilatation is an ominous sign.
I think it is worth propsoing and pursuing a new concept.” LA dimension has a U curve phenomenon at least within the certain Iniital increments either in size or volume” . LA cannot be too stiff, at the same time it can’t yield out like a balloon.When does an LA decide to dilate and when does it resist is the question ? An agile atria without fibrosis, degeneration, and optimal fluidity extracellular matrix could be the defining factor.
Final message
Understanding the duality in the realtionship between LA size and E deccleration time seems to be crtical. A stiff, non-compliant LA aligns with a short DT and an inverse relationship with LA size in high-pressure states.A relaxed, accommodative LA with mild enlargement may not affect DT significantly and could even normalize it by reducing LA pressure, especially if DT was prolonged due to early LV diastolic dysfunction.
This behavior underscores why LA size and DT must be interpreted along side other factors like LA pressure estimates (e.g., E/e’ ratio), LV compliance, and the underlying pathology.
* A research question for fellows in cardiology