Ventricular pressure volume loop is an Important concept (often fearsome !) to learn for cardiology fellows . . . I would say , It is not that hard to understand !
These loops tell us the secret hemodynamic story of heart. Made with 300 grams of mystery muscle, the heart handles about 100 ml of blood every beat, and successfully ejects around 70 ml into Aorta and Pulmonary artery * ·
 ’
’
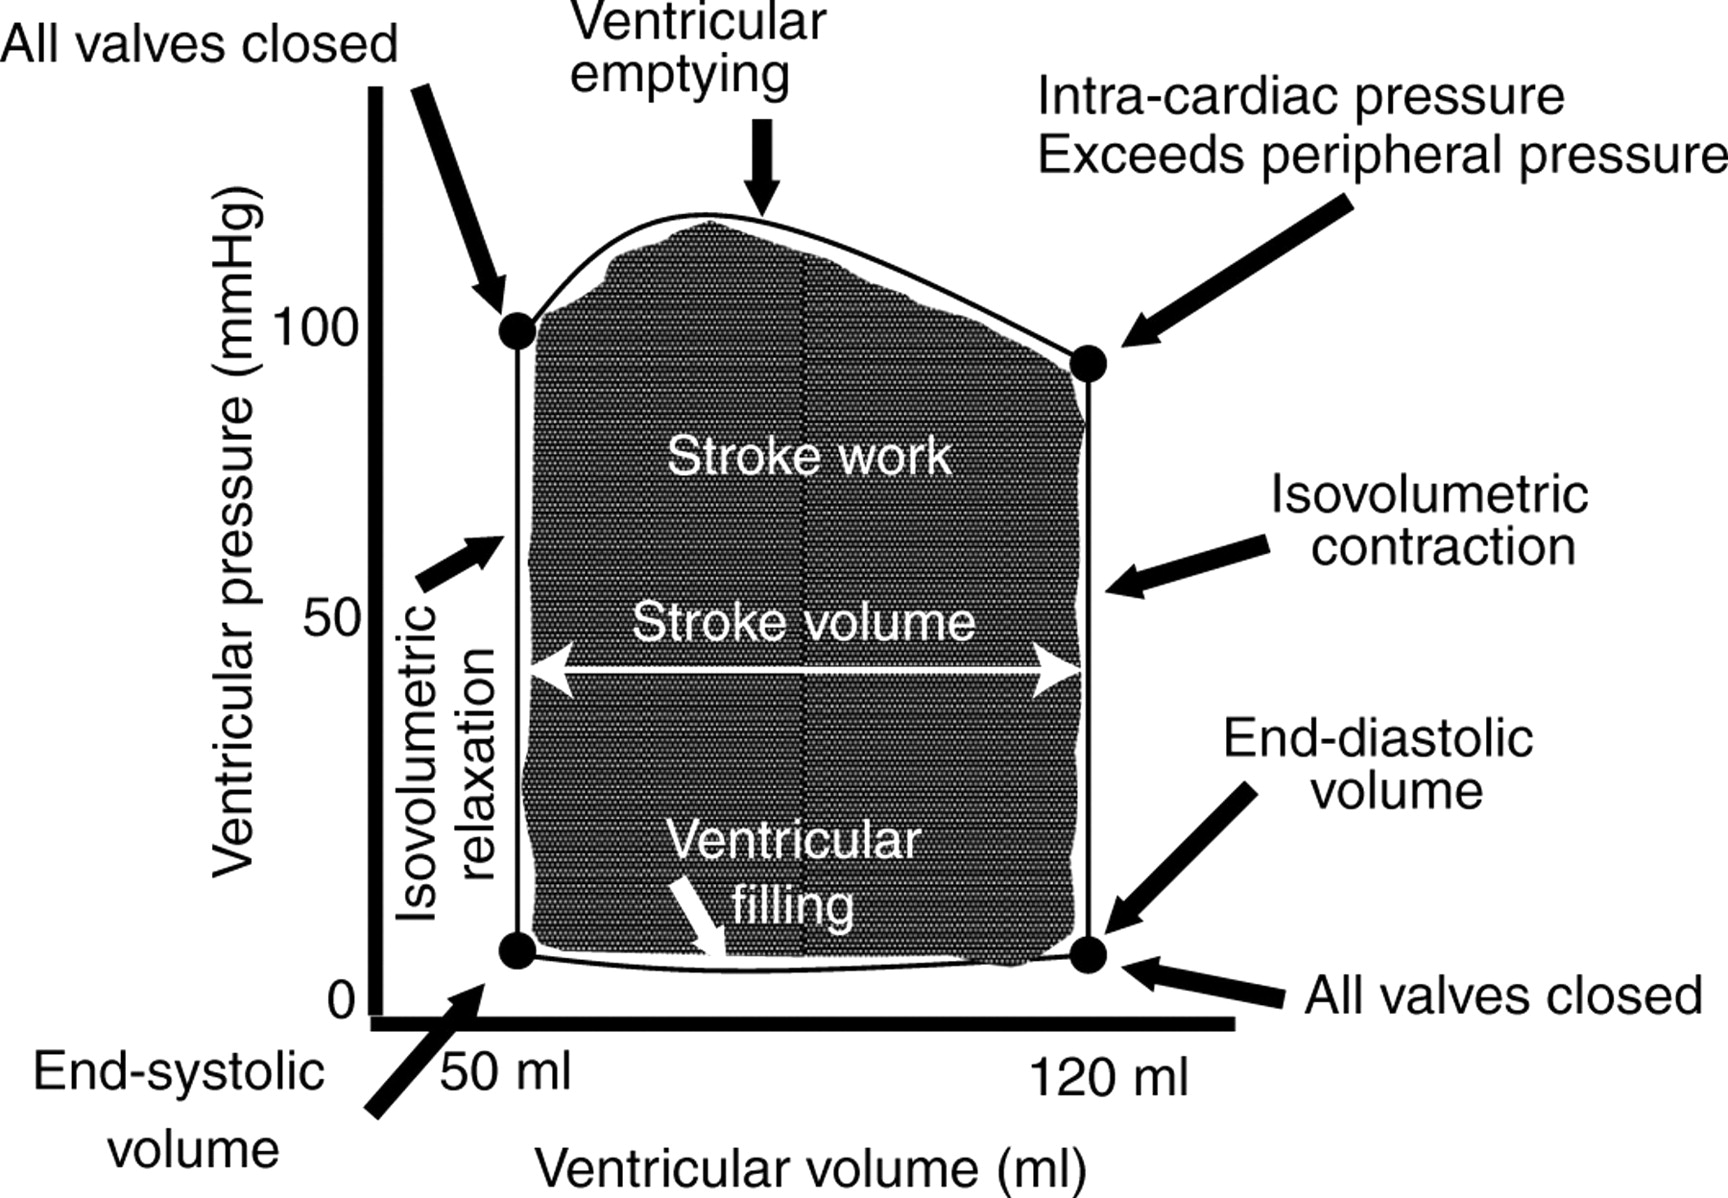
While doing this life sustaining job , It would seem the heart muscle conducts a perfect, non stop, hemodynamic orchestra with 4 electro-mechanically coupled phases which is depicted as classical ventricular pressure volume loop. Mind you, this loop is plotted from pressure volume data from a single heart beat and it can’t be time correlated with heart sounds or ECG as the two parameters loop around in the same time cycle.
Watch this animation , carefully and read the appearing annotation that come along with each phase.That should suffice to understand the basic. (For Audio version go the video link in the reference )
Modified from a clipping from Giphy.com.Original source of this Image is not located. Whoever has done this thanks and it’s a great attempt.(I have tried a fusion Image of doppler mitral Inflow in diastole and Aortic pressure curve during systole to bring PV loop an anatomical perspective.)
*Note: When we say PV loop it means about by LV by default . We do have seperate RV ,LA (even RA?) PV loops.
Is there clinical application for PV loops ?
It may not have any direct use , but understanding how a ventricle works in normal conditions or at distress especially during acute decompensations or after surgery is vital. With modern gadgets like LV assist devices, Impella used widely and to assess hemodynamic efficiency of transplanted (Very soon total artificial hearts) , PV loop analysis of both RV/LV will be critical.
Is there any simple Lab modality that can draw this Loop curve instantaneously ?

Very few companies make it . AdInstruments that make power lab monitors, enable us to visualise PV loops invasively .
Can we get PV loops non invasively by Echocardiography ?
Echocardiography provide us both volume and pressure data.With improving accuracy of data it should be possible to plot the loop manually with some effort. (Still , we can’t get pressure in all points of cardiac cycle )
I guess, sooner 3D volumetric machines with automated online doppler pressure data across the valves can help us draw the ultimate LV functional curve live on real time.If that happens cardiologists will be further enriched and hemodynamically enlightened !
Final message
The shape , size , timing and the slopes of this loop givs us vital info about the functional aspects of ventricle. First one should understand the normal loop , then , we can dwell on the effects of acute and chronic lesions like regurgitations, cardiomyopathy ,cardiogenic shock etc.
An excellent knwoledge base on the topic with a video
Dr. Richard E. Klabunde, PhD


