A patient who had a PCI some time back , asked me in one of his recent visit.
Doctor what is microvascular endothelial dysfunction and erosison ? Am I at risk of developing it ?
What am I supposed to answer ? Yes, I some how managed .” Don’t worry , it is a complex biological phenomenon. you need not go deeper into that. Take medicines regularly” He wasn’t happy with my answer is a different story.
A simple tip for peace of mind … for the modern patient
If the current generations of patients , equipped with hyper-knowledge engines, insist to understand 100% about their illness, imagine the consequences to the global healing system ,that has so many ground level issues to bother about.
Oneunofficial estimate from an elite , professional academic chatterbox of medicine suggests that the knowledge base with which doctors diagnose, treat, and understand the diseases they tackle, is at best 15%. Pateints need not be thankful , but atleast understand we are for working around with 85% ignorance, and still tries to bring out the best. I am sure this is a fact, no one can disagree ,regardless of the presence or absence of evidence to support it.
Final message
It might appear fair if someone argues blind faith in a trusted physician or hospital could end up as unscientific or unethical. But,what they fail to realize is, sciences’ blindness can be much darker, especially when it comes to the outcome of treatment and prognosis.
Does this sound a difficult question ? Many felt so. Hence, I decided to chat with the popular AI machine.It is a brief little chat that surprised me .Please click the link , you can learn somee academic manners from the machine.
Last century’s rockstar drug, statin do stimulate cholesterol/sterol abosorbtion as well as possible neo-hepatic synthesis.This is basic bio-feed back mechansim , when one molecule is blocked in a living organsim. We must be aware, It is a less popularised truth (Intentionally ? ) among the cardiology community,
Ofcourse LDL comes down, at the cost of residual pre -choleterol particles that spill over to circulation resulting in hepatic and skeltal muslce injury.
There is an important corollary and a pharmacological cross invention and a new big market for a otherwise orphan drug called Ezetimibe.
It is not an optional accessory in statin therapy as many would like to think. There is good scientiifc logic, with and and without evidence though , that Ezetimibe, is an essential add on adjuct for optimal statin action.This is understandable, since statin consumption systematically depletes intracellular cholesterol, make the entire small intestine hungry for cholesterol by a bio – feed back mechansim once its synthesis is blocked.
There is also some concern liver might also synthesise some abnormal new unnamed lipids ,? as its normal cholesterol pathway is blocked. These info were never released to clinical domain.
Final message.
Statin tiggers increased lipid absorbtion at the intestines. Stand-alone statin therapy, still turns out to be a suspect value in atleaset one third of users as the bio -feed back surge could not be countered effectively. However, for statin to be optimally effective,add on Ezetimibe helps.
Also, It is clear one of the important duties, of medical professional is to teach the AI engine and help correct potential and real mistakes in its data base.
Reference
This is evidene less cardiology , ie class C evidence.Experts may add, dispute and contibute to this thread.In the process Chat GPT might learn as well.
The standard answer needs to be, mechanical valves can last up to 25 years or more. But, we are in a techno-conflict era. Instead of working on the longevity of the valve, ( with concerns for long-term OAC ) we fell for the biological valves. Curiously, this has made the durability of the valve, a less relevant discussion in many centers. We get excited when some company brings out a long-lasting bio-prosthetic valve that can live up to a maximum of 15 years.
Now, the biological valve comes in a new avatar ie TAVI, in a big way. Soon, we may celebrate an event free 10 years after TAVI. Going percutaneous is transformative. But at what cost? Fusion of metallurgy, chemistry, and pharmacology should make it possible for in-vivo metal valves to be safe for 75 years of human life span. The irony is we almost had one, One valve’s longevity was consistently exceeding the patient’s life span,(at least as far as we observed in the Rheumatic heart disease) This has been the star of all valves. We know what happened to that valve.
This SE valve in the mitral position
Final message
Most SE valves are implanted in the mitral position. Starr-Edward in an Aortic position working for 50 years is a big proof of reality. Of course, we can’t extrapolate with a single case report. We have stopped the production of these valves. So, there is no way to test it either. Anyway, cardiologists, cardiac surgeons, and finally the generation X, TAVI Innovators have something to learn from this case report. Forget Starr-Edwards, It looks like, there are some invisible forces that work against mechanical valves in recent times, which may not be good for our patients as of now. (There is something interesting related to this in Ref 2)
Future directions: Past need not be past
Nothing is impossible for our hyper-talented scientists, except probably in the “faculty of looking back” the past-Innovations (falsely labeled as obsolete) and bringing them again to optimal usage. If cardiologists feel surgical AVR injures their interventional pride, how about a percutaneous cage delivered at the root of the aorta, after ablating native leaflets, followed by an inflatable silicone ball?
A current 2023, opinion from the renowned Dr. Catherine Otto on this Mechanical vs biological valve , Indications, current usage pattern, the cut-off age, etc
This is a re-blog from 2010 pages of this site.
Hope we have more updates.Spouse behaviour as significant CAD risk factor, is still a valid research concept that shall lead to more productive social “cardiac Interventions” and prevent CAD burden outside the much glamorised cathlab
American journal of epidemiology in a land mark analysis has found , spouses share the same profile of coronary risk factors .This is a huge finding , considering the fact that , genetic factors are not involved here . So , it is something to do with family diet ? domestic issues, sibling effect ?
It is well-known lipid profile of family members are comparable . There are many Indian families who have high basal triglycerides .Mind you, husband and wife is the least (Zero link) linked genetically for familial dyslipidemia ,still they often share a similar lipid profile
Related issues without answers !
When a spouse gets a coronary event what are the chances of other to develop an event ?
Any body’s guess
In this era of bi- polar family life, can spouse behavior /unrest be a coronary risk factor ?
Exclusive plant based diet protects heart and vasculature. Is it true ?
“Yes it is.“
“No, It doesn’t.“
“Yes, a little bit”
So, the answer is not stright-forward. Then as a scientist what should we do ? Do some good studies.
Do we have it ? Ofcourse, we have far too many to confuse us.
Which study showed vegetarians has less risk of CAD than non vegetarians?
There have been several studies that have explored the association between vegetarian diets and the risk of coronary artery disease (CAD) compared to non-vegetarian diets. While not all studies show consistent results, some research suggests that vegetarians do have a lower risk of CAD. Here are two examples from heap of research on this topic.
The Adventist Health Study-2 (AHS-2): This is a large prospective cohort study that included more than 73,000 participants, including both vegetarians and non-vegetarians. The study found that vegetarians had a lower risk of hypertension, diabetes, and metabolic syndrome, all of which are risk factors for CAD. The results also indicated that vegetarians had a lower risk of heart disease compared to non-vegetarians.
EPIC-Oxford Study: This is another large prospective study that included over 45,000 participants in the United Kingdom. The study compared the risk of CAD between vegetarians and non-vegetarians and found that vegetarians had a lower risk of heart disease.(EPIC -OXFORD long term follow up 2022 available Ref 2)
Post -research sequale
Does every one agree with these studies ?
The answer is “No” again
Why ?
There are three issues come to my mind
1.First of all, we have a problem in defining not only the CAD* but also who is a pure vegetarian and who is an impure non-vegetarian. (*Clinical vs. nonclinical, ECG or CAG-based, etc.)
2.There are too many parameters, both endogenous and exogenous, that determine the incidence of CAD. This can pose a real challenge to any sophisticated logistic regression model. This includes epigenetic, food, and atmospheric interactions with the endothelium. Technically, if you were to include polluted air as a bad diet equivalent, it would make things really difficult for the poor research fellows.
3. Finally, our understanding of the difference between cardio-vascular risk factor vs acute trigger (both emotional or physical which actually precipitate the event.) , is not perfect, These can profoundly influence the true Impact of diet over CAD and throw the results of all these studies topsy turvy.
Final message
Pardon me, for some confusing content in the post .I go with with EPIC-OXFORD conclusion. Plant based diets are indeed CAD protective. As someone said, everyone would like the right answer to be linked to their belief system, whether humans are really herbivores or not.
“Observe your thoughts,don’t believe them” Eckhart Tolle
High value
1.Pacemaker & Defibrillator
2.Heparin in Acute coronary syndrome
3.Diuretic therapy for cardiac failure & pulmonary edema
Low value
1.PCI> 24 hrs after STEMI
2.Most CTO Interventions
3.AF ablation
Strong contenders for high value Interventions
1.PTMC
2.Thrombolysis & DAPT
3.Diet and excercise modulation
Strong contenders for low Value Intervention
1.TAVI in young & SAVR eligible population
2.Mitra clip
3.LAA appendage closure
Final message
Unfortunately, most of us are blinded (artificially though!) to quality check , outcome assessment, & comparative effectiveness with already available treatment modalities.Every cardiologist shall create their own value based list of intervention according to their conscience, and stick it on the consultation table as a ready recokner.
Counterpoint
Value is a subjective concept that can be challenging to define precisely. It may not always apply equally to every individual.Ideally, population based value assessment should give us the true value. Reality is different. In some cases, what may seem like nonsense to others can hold significant value for a particular person. This highlights the importance of recognizing diverse perspectives.
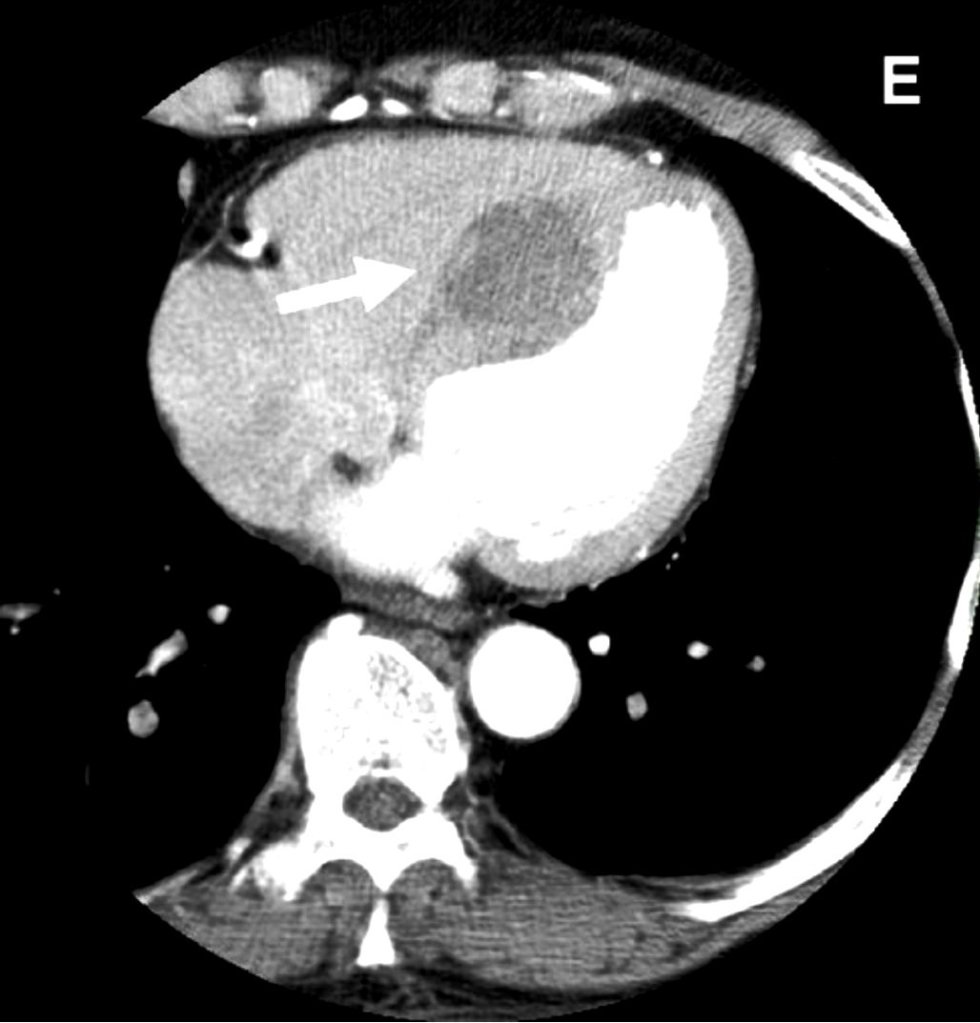
It looks like an Intracardiac tumor, a myxoma ? a variant of HCM ? Is it a hydatid cyst, ?
No it’s not. I can give one clue. This is a man-made condition.
Oh ok, did this happen inside the cath lab ?
Yes, you got it, right. But need a diagnosis.
Can you give me one more clue?
This patient was undergoing PCI for chronic total occlusion.
So, it must be a complication. Then I need to know the list of complications during CTO PCI.
Yes, but you may not find this one in the conventional list. Let me come out with the answer.
Answer
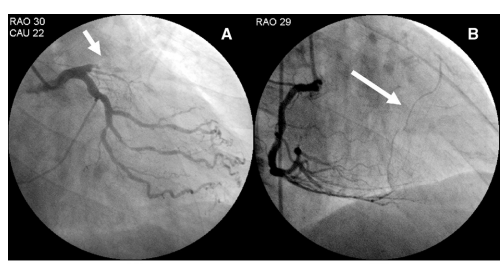
It is a huge septal hematomadue rupture of vulnerable septal collateral during retrograde wiring for opening LAD CTO.It usually occurs due to o prolonged procedures and hardware-related injury. Thanks to the authors from Taiwan to post this case report. (Image Courtesy Lin & Wu 2005 Ref 1)
Lessons from this case report (Not meant to offend anyone )
This case gives us some important lessons to be learned. One of my senior colleagues used to say, opening a CTO is ok, but using a retrograde approach with aggressive deploying of hardware within the last remaining lifeline provided by the donor coronary artery is a culpable coronary crime unless it is a life-saving procedure.
The often used term “septal surfing” adds an “adventure sport feel” to our youngsters posing as an interventional challenge and amplifying the potential injury. The fact that epicardial collaterals have a larger caliber, but the temptation to cross it, is significantly suppressed (or even forbidden) due to the risk of tamponade. However, this doesn’t in any way give us the freedom to toy with septal collaterals. Proliferating hardware (Innovative though ) is also an issue. It is true, technological input is a pillar for the growth of science. However, it is a sad fact, many of us are compelled to learn risky, unscrutinized tricks exclusively from academically unbaked industry guys, rather than from mainstream literature.
Final message
“No procedure … no complication”
I could recall, one of my colleagues displayed this caption as the last slide in a cath lab workshop, after a talk on How to avoid complications in the cath lab.
Very true. But, CTO by itself never belongs to a malignant subset of CAD, as some sections of the cardiology community would want us to believe. CTOs do need an intervention, only as a life-saving /0r severe symptom-relieving procedure. Most of them aren’t. They present with stable angina because of extensive collaterals. Unfortunately, instead of respecting this, many of us are asked to close these channels and try to maintain antegrade flow. The irony is, to open the CTO we may end up sacrificing these life-saving channels.
If you think this quote is too brutal, please visit the Nobel laureate Initiative “Lown Institute” website and spend some time, to find solutions to rescue the medical profession, which is rapidly drowning in a sea of ethical dysfunction.
A simple question with mammoth repercussions in the revascularization world.
How was the question ? Was it difficult ?
Don’t worry, it wouldn’t be the same even for elite cardiology experts worldwide. It is not a Himalayan task, though, to find an answer. All it requires is a simple FFR run through pre and post PCI (Now RFR, iFR, QFR). Surprisingly, very few inquisitive minds wanted to do this. I can find 5 related papers. The fifth one is very specific: REPEAT-FFR study. Go through at least that one paper and find the answer yourself.
Cardiology fellows it is worth reading about this important study , might be asked in exams.
Final message
The conclusions from these studies are not really baffling, but demand a lot of academic cleansing of our understanding about the relationship between epicardial patency and microvascular flow.”It is obvious from these studies that epicardial PCI never guarantees good revascularization with a FFR backing “
Every cardiologist should ask this question before they scrub, whether the PCI, they are going to do today, would improve the net-myocardial flow, LV function or symptoms . Are we doing justice to our patient (or blindly practicing science) who is quietly lying on the table, with a mix of anxiety and trust, with a complete belief that what they are undergoing is a life-changing or life-saving procedure.
Further, it is our duty to restore the lost glory to the defamed , stigmatised medical management of CAD & Impress our patients that “All that, doesn’t glitter could be pure gold as well”
The contents of the this blog is being published as Kindle E book , as per the request of many of the readers. Every article will continue to be open source in this site. Again I shall reiterate the book format is not aimed at any commercial intent. It is only to facilitate learning in a single book format Here is the link to book https://amzn.in/d/euhL5vu
Click below to see who is watching this website live !
This site will never aim for profit. Still ,this donation link is added at the request of few visitors who wanted to contribute and of-course that will help make it sustainable .
Please Note
The author acknowledges all the queries posted by the readers and wishes to answer them .Due to logistic reasons only few could be responded. Inconvenience caused is regretted.